

Cover photo: Bruno BD / Unsplash.
Verify the lead counter before the channel
When rankings rise while leads fall, verify that both statements describe comparable audiences and consistent measurements. Then separate changes in search demand, query mix, landing pages, conversion rate and lead qualification. The useful result is an explanation of where the loss occurred and what evidence supports it. A better average position cannot, by itself, show whether your business gained or lost valuable opportunities.
Begin with the lead counter because a definition change can resemble a marketing failure. Write down what counts: a successful form submission, a connected telephone inquiry, an accepted sales opportunity or a booking. Specify whether repeat contacts, existing customers, spam and out-of-area inquiries are included. Compare those rules with the earlier period. A dashboard labelled leads may quietly combine actions that your sales team would never treat as new opportunities.
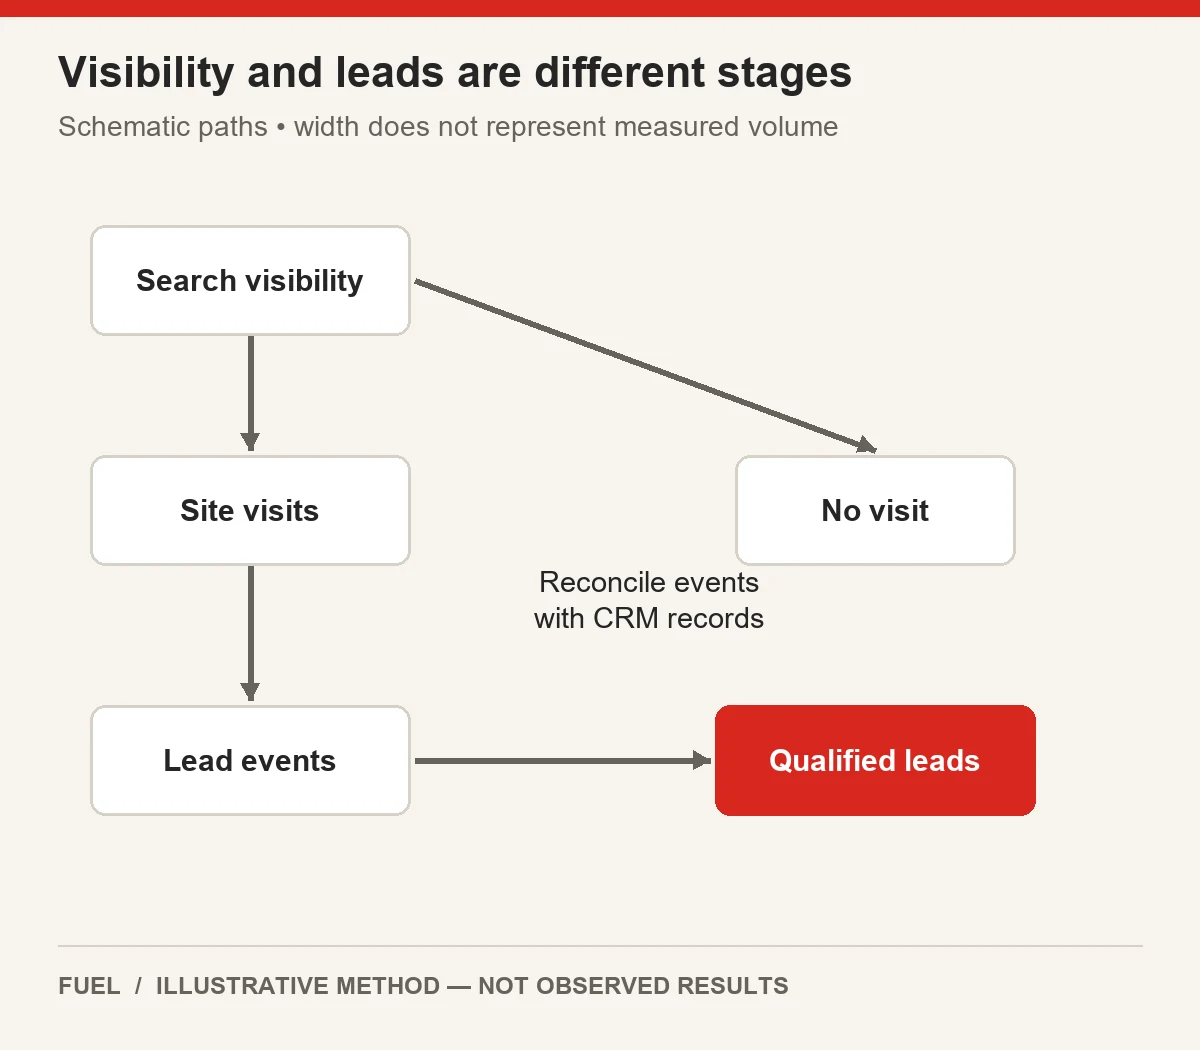
Reconcile a small sample of records from the event through to the receiving system. For a form, check successful submission, analytics event, CRM arrival and assignment. For a telephone inquiry, distinguish a button click from a connected call and its eventual classification. Record the test time and identifiers that allow the teams to match the same event. A broken handoff can reduce CRM records even while the website continues receiving genuine interest.
Google documents differences between Analytics key events and Ads conversions arising from attribution, counting and window settings. Treat those as measurement dimensions to reconcile, rather than assuming every report must display the same total. If your company changed its event setup or imported conversion action during the comparison period, save the before-and-after definitions. Do not repair an apparent discrepancy by adding incompatible totals together. Read the supporting Google documentation.
Also inspect consent behavior, duplicate firing, spam controls and form release history where relevant to your implementation. These are diagnostic hypotheses, not findings about your site. A stricter spam filter may lower reported volume while improving the useful share. A missing success event may lower the dashboard while leaving CRM demand intact. The first decision is whether the decline exists in real accepted inquiries, measured actions, or both; the rest of the investigation depends on that distinction.
Keep periods and cohorts comparable
An organic lead decline needs a stable comparison. Align date windows, weekdays, business opening patterns and the time available for an inquiry to become qualified. A current week of fresh inquiries should not be compared with an older week whose sales team has finished classification. Freeze a cohort by inquiry creation date and show how many records remain unresolved. Revisit it after an agreed maturation interval rather than silently recategorizing old reports.
Build the initial comparison with the same country, device and search type. Then inspect those dimensions separately. A business serving one country can gain international information searches while losing domestic commercial visits. A mobile release can damage mobile inquiries even if desktop activity holds steady. The overall total hides both situations. Do not subdivide until every row becomes too small to interpret; start with segments tied to the actual offer and the timing of the incident.
Keep analytics scope consistent. Google's user-acquisition and traffic-acquisition documentation distinguishes first-user dimensions from session dimensions. Someone originally acquired through organic search may return through another route. Comparing a first-user organic total with a session-organic total changes the question, even when the report headings look similar. Record which view supports your investigation and avoid treating scope differences as recovered or missing traffic. Read the supporting Google documentation.
Seasonality also requires an explicit choice. A preceding-period comparison can reveal a release incident but misread normal seasonal demand. A year-over-year comparison helps contextualize seasonality but introduces changes in offers, tracking and market conditions. Use both when they answer different questions. Put known promotions, holidays, closures and measurement releases on the timeline so the explanation does not depend entirely on the shape of a line chart.
Define the fixed cohort before examining favorable results. For example, choose nonbrand commercial searches for supported services in the operating country, then compare mobile and desktop separately. Preserve the same query classification rules for both periods. New queries can sit in an expansion cohort instead of being allowed to redefine the original one. That leaves you able to say whether established commercial demand weakened, whether newly gained traffic converted differently, or whether the available data cannot separate those effects.
Decompose traffic mix and landing pages
Now decompose branded versus nonbranded traffic and informational versus commercial demand. A brand query often reflects existing awareness; a general question may reflect early research. Neither category is automatically valuable or worthless. The issue is whether their proportions changed and whether those changes explain the business outcome. Keep an unclassified bucket for ambiguous searches instead of forcing every phrase into a buying-intent label.
Consider this explicitly hypothetical position example. In the first period, commercial query group A has 900 impressions at average position 9, while informational query group B has 100 impressions at position 1. The impression-weighted average is (900 × 9 + 100 × 1) ÷ 1,000 = 8.2. In the second period, A has 100 impressions at position 10 and B has 900 at position 3. The average becomes (100 × 10 + 900 × 3) ÷ 1,000 = 3.7.
The aggregate improves from 8.2 to 3.7 even though each group's position worsens: A moves from 9 to 10 and B from 1 to 3. The mix shift produces the apparent improvement. These numbers are invented to demonstrate arithmetic; they are not a Fuel result or a search benchmark. The calculation assumes comparable impression-level groups and deliberately simplifies the reporting environment.
Hold the original 900/100 weights fixed to test the interpretation. Applying those weights to the second period's positions gives (900 × 10 + 100 × 3) ÷ 1,000 = 9.3. The fixed-weight result exposes deterioration in this hypothetical panel. It is a diagnostic comparison, not a replacement for Google's reported metric. Google's Performance report uses topmost-result and aggregation rules, so preserve the report dimension and avoid blending property and page totals as if they were identical. Read the supporting Google documentation.
Repeat the reasoning for landing-page mix using actual available data. Identify whether traffic shifted toward guides, low-fit services, unsupported markets or a generic homepage. Then examine matched page groups rather than accusing an individual page merely because it grew. Search Console query evidence and analytics landing evidence usually answer different parts of the story; do not imply a precise query-to-qualified-lead join unless your measurement genuinely supplies it.
Separate conversion rate from qualification
Keep the funnel denominators visible. For a deliberately simplified example, define eligible organic sessions as the website visits included in one consistent session-scoped cohort. Define submitted inquiries as deduplicated successful submissions from that cohort, and qualified inquiries as those accepted under an unchanged sales rule. Then qualified inquiries equal eligible sessions multiplied by submission rate multiplied by qualification rate. This identity organizes the investigation; it does not explain why any component changed.
Suppose the first period has 1,000 eligible sessions, a 5% submission rate and a 60% qualification rate. That produces 50 submitted inquiries and 30 qualified inquiries. Suppose the next period has 1,200 sessions, a 4% submission rate and a 40% qualification rate. That produces 48 submitted inquiries and 19.2 expected qualified inquiries. The decimal is appropriate for an illustrative expectation; real observed inquiry counts would be whole records.
A sequential bridge makes the contributors legible. Starting from 30, increase sessions alone: 1,200 × 5% × 60% = 36. Next apply the lower submission rate: 1,200 × 4% × 60% = 28.8. Finally apply the lower qualification rate: 1,200 × 4% × 40% = 19.2. The steps contribute +6, −7.2 and −9.6, summing to the net change of −10.8 expected qualified inquiries.
Those contributions depend on the order chosen because the factors interact. Label the order and do not present it as a unique causal allocation. For a management review, the practical implication is that greater volume did not offset weaker submission and qualification rates. Investigating only rankings would miss most of the useful questions. A different ordering can be calculated as a sensitivity check when the allocation itself affects a budget decision.
For real records, track why inquiries fail qualification. Separate unavailable service, unsupported geography, inappropriate budget or timing, duplicate inquiry and unreachable contact. Keep pending records separate from rejected ones. A falling qualification rate can result from a traffic-mix shift, changed acceptance policy or operational backlog. Without those reason codes and consistent processing, it is easy to blame page content for a change that happened after the inquiry arrived.
Investigate offer and journey friction
Once the loss is localized, test the relevant journey rather than redesigning the entire website. If submissions fall only on mobile service pages after a release, reproduce that path on mobile. If qualification falls mainly in a newly expanded market, inspect the offer and geographic messaging there. If all sources lose CRM arrivals at the same time, prioritize the shared handoff. These tests have different owners and should not become one undifferentiated SEO ticket.
A useful segmentation worksheet has one row per coherent cohort and columns for period, demand category, landing family, device, country, sessions, successful inquiries, qualified inquiries and unresolved records. Add measurement version and known release dates. Leave unavailable values blank with an explanation rather than substituting zero. Zero means you observed none; missing means you cannot currently observe the value. Confusing them can create a fictional incident.
Test the page's promise against the inquiries being rejected. A service page may use broad language that attracts buyers the business cannot help. Clarifying genuine coverage, eligibility or the process may improve fit even if submission volume decreases. Conversely, an unnecessarily restrictive form might exclude valuable prospects. Decide what information a suitable visitor needs, then test the smallest change that makes the offer clearer without inventing exclusions to manipulate a metric.
Follow a successful submission to its destination. Does the requested service survive the handoff? Is the correct location assigned? Does the confirmation tell the prospect what happens next? Can the receiving team recognize the lead source without overriding the original record? Record operational availability, especially when the incident coincides with changed hours or staffing. A marketing report can expose an operational bottleneck without proving that marketing caused it.
Keep the chart's position-mix example separate from this journey worksheet. The 8.2-to-3.7 illustration explains aggregation; it supplies no evidence of form failure or weak sales follow-up. Connecting those topics requires actual observations. Record each proposed explanation alongside the data that would support it and a counterexample that would weaken it. This prevents a compelling hypothetical story from becoming the diagnosis before the team has checked the real path.
| Field | Evidence to retain |
|---|---|
| Cohort | Brand class, intent, supported market and device. |
| Acquisition | Session scope and measurement version. |
| Inquiry | Successful deduplicated action and CRM arrival. |
| Qualification | Accepted, rejected with reason, or pending. |
| Comparison | Matched dates, maturation window and known releases. |
Choose the next investigation by evidence
Choose the next investigation by the evidence that can distinguish competing explanations. A hypothesis should name a segment, mechanism and observable test. Mobile contract inquiries dropped after the form release is a better starting point than SEO stopped working. Ask whether the submission succeeds, reaches the CRM and receives the same classification as before. If it passes, move to another explanation rather than repeatedly adjusting unrelated title tags.
Assign one owner and an acceptance condition. Analytics owns event reconciliation; web delivery owns a failing form; operations owns routing or availability; content owns an inaccurate offer. Some incidents cross those boundaries, but the individual action still needs a responsible person. Set a review date based on the work and the volume of evidence needed, not a promised ranking recovery. A repaired test can pass immediately while business results remain unobserved.
Use a decision log with four fields: observed fact, interpretation, next test and current status. An observed fact might be that CRM records from a test form are absent. The interpretation might be a broken integration. The next test checks the receiving endpoint or queue through the approved system. The status stays unresolved until the actual handoff is verified. This structure keeps a plausible explanation from receiving the same weight as a confirmed fault.
When several components remain uncertain, start with tests that are both consequential and inexpensive to reverse. Verify measurement and broken customer actions before commissioning a broad content expansion. Preserve the stable comparison segments so that later changes do not erase the baseline. If you change several things together, document the bundle and accept that the result may not isolate each contribution. That limitation is more useful than attributing every improvement to the tactic you prefer.
A scoped SEO investigation should produce a reconciled timeline, a segmented loss estimate and a queue of evidence-backed actions. Bring the relevant reports and operating definitions to the review. The useful service is diagnosis tied to implementation, including the cases where the data points toward measurement or operations. A team should be able to explain why the next action addresses the observed loss and what remains uncertain after the action ships.
For implementation support, review Fuel’s SEO services. Share the affected scope, actual evidence and the decision you need to make.
How to report the result without claiming causation
Report the finding as a chain of supported statements. For example: the original commercial cohort lost sessions; the aggregate position improved because the query mix changed; the submission test passed; qualification remains incomplete for the newest cohort. That communicates progress without collapsing every stage into one verdict. Where the data cannot support a calculation, state the missing denominator and the evidence needed to complete it.
Keep observed outcomes distinct from modelled arithmetic. The hypothetical 900/100 example demonstrates that a mix shift can reverse an aggregate interpretation. The separate funnel example demonstrates how volume, submission and qualification combine. Neither establishes the cause of a real incident. For the actual business, use its reconciled records and preserve the comparison rules so another analyst can reproduce the conclusion.
Close the investigation when the relevant fault is corrected and its acceptance checks pass, while continuing to observe business outcomes under the agreed measurement. If the evidence identifies no fault, explain the remaining uncertainty and choose a bounded follow-up. The objective is a defensible decision about the source of lost qualified demand, rather than a more elaborate dashboard that still leaves everyone arguing about what the word lead means.