

Cover photo: Jerome Cha / Unsplash.
Define each local metric precisely
Compare map views vs calls by separating profile exposure, call-button activity, connected conversations and qualified inquiries. Then compare locations within similar operating conditions. A branch with more profile views is not automatically doing better, and a branch with fewer calls is not automatically underperforming. The useful question is which part of the path differs after accounting for service mix, market, hours and the way each system counts activity.
Start with a metric dictionary that names the system and its denominator. Profile views, call-button clicks, telephone-system calls and CRM opportunities are different records. A website telephone link can generate a call without a Business Profile click; an existing customer can click a profile's call button without creating a new opportunity. Keep those distinctions visible before calculating a rate or comparing managers.
Google defines the Business Profile Calls metric as clicks on its call button, rather than answered or qualified calls. Its Views metric concerns profile viewers with deduplication rules, rather than every exposure to the business. Google also says profile performance includes organic and Ads activity. Therefore, a profile activity total should not automatically be labelled organic leads, and a click-to-view ratio should not be labelled a booked-customer conversion rate. Read the supporting Google documentation.
Write a qualification definition that the locations can apply consistently. For example, an accepted inquiry might require a new customer, a supported service, an address within the genuine service boundary and a contact the team can pursue. The exact criteria belong to the business. Keep existing customers, duplicate contacts and unresolved inquiries separately identifiable. If one branch accepts a different class of work, preserve that difference rather than forcing its outcomes into another branch's rule.
Assign a stable internal location ID across exports. Public names, tracking lines and page URLs can change while the physical or operating branch remains the same. Record the profile, destination page, telephone route and CRM assignment associated with that ID during the reporting period. This small reconciliation prevents a renamed location, forwarded number or shared call center from appearing to create a sudden improvement or loss that is really a change in ownership of the records.
Choose comparable location cohorts
Choose comparable location cohorts before ranking performance. Match the services offered, customer eligibility, operating hours, maturity and reporting period where those factors matter. A newly opened branch, a mature storefront and a service-area operation can have legitimate differences that raw totals cannot explain. Compare each location with relevant peers and its own stable history; do not assume every point on a map should produce the same demand.
Document exposure to paid promotion separately where records allow. A location receiving a larger campaign can gain profile actions without an equivalent organic change. If the reporting surface cannot isolate the source, state that limitation. Do not subtract an unrelated Ads total from a profile total to manufacture an organic remainder. Their definitions, time windows and attribution may differ, and the result could look precise while having no coherent meaning.
Geography also changes the comparison. Google describes relevance, distance and prominence as main local-ranking factors. Distance depends on the searcher, so a location's address is a structural part of its opportunity. Review those documented factors as context; they do not justify inventing a local office or claiming that an identical page template should produce identical visibility across markets. Read the supporting Google documentation.
Make a cohort sheet that includes opening and closing dates, supported service categories, staffed hours, capacity restrictions and unusual events. Include temporary closures, service pauses or booking-system changes that overlap the period. A normalized measure can be useful only when its exposure unit makes sense. Calls per staffed hour may help examine workload, for example, but it does not make two branches equally discoverable or their markets equally large.
Preserve both the original totals and the normalized view. If you divide inquiries by open days, show the counted days and the rule for partial closures. If you compare service-specific qualification, show how many records remain unclassified. Small cohorts should carry more uncertainty than large ones. Avoid turning a handful of contacts into a definitive branch league table, especially when a single late qualification decision can materially change the apparent order.
Connect profile actions to operational outcomes
Use operational records to understand the path after the click, while being honest about whether the systems can be linked. A call platform may provide time, destination, connection status and a business classification. A CRM may supply opportunity, booking and outcome records. A Business Profile export supplies aggregate activity. These sources can be reviewed together without claiming that each profile viewer or call click has been matched to an individual customer.
Consider an explicitly hypothetical same-period snapshot. Location A has 1,000 profile views, 40 call-button clicks and 10 qualified inquiries recorded in its separate operating system. Location B has 500 views, 20 call-button clicks and 12 qualified inquiries. Both have 4 call clicks per 100 profile views. A has twice the profile exposure and twice the click activity, while B has more recorded qualified inquiries. No person-level linkage is supplied in this example.
The separate-system ratios are descriptive signals. A has 1 qualified inquiry per 100 profile views and B has 2.4, but those are not verified profile-viewer conversion rates. The qualified inquiries may include other contact routes, and the viewing and inquiry populations are not proven identical. Similarly, dividing 10 by 40 or 12 by 20 would not establish the share of call-button clickers who qualified. The missing link matters more than the ease of the arithmetic.
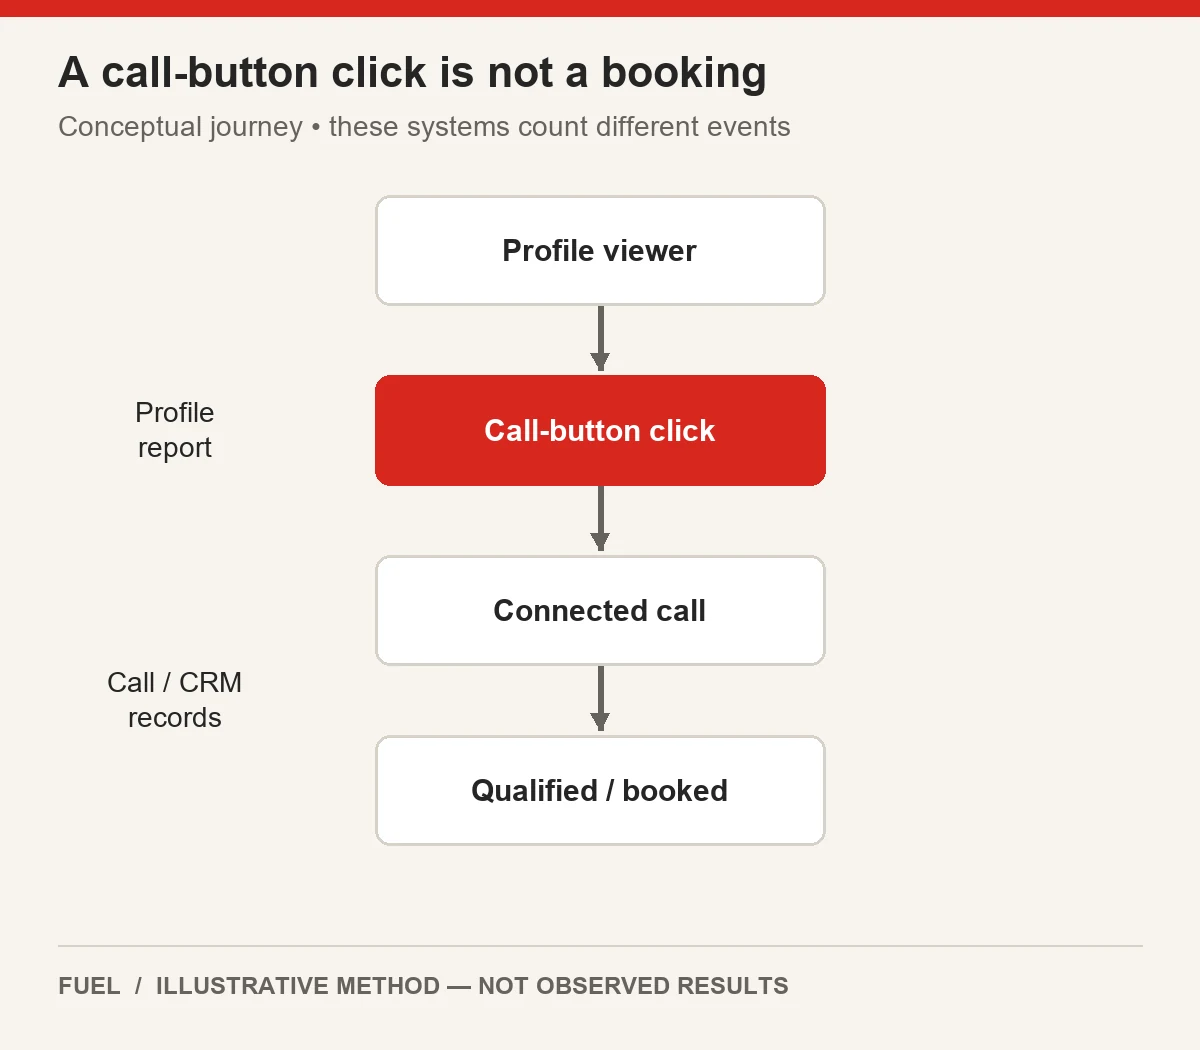
The supporting diagram is a conceptual journey, not an observed attribution chain. In an actual data report, use solid arrows only for a handoff that the actual measurement can establish; use a clearly marked aggregate comparison where it cannot. If a shared phone number receives traffic from many sources, classify its calls as that shared route unless a defensible source record exists. Attribution should follow evidence rather than whichever channel the reporting team wants to demonstrate.
Where record matching is available through authorized systems, document the matching key, coverage and exclusions. Deduplicate repeat contacts consistently and preserve an unknown-source category. Where it is unavailable, report aggregate trend comparisons and avoid individual conversion claims. In either case, distinguish missed, answered, qualified, booked and completed work. Each stage answers a different operational question, and a rise in one cannot be assumed to carry through to the next.

Explain divergence before ranking branches
Before ranking branches, examine whether the mix of work explains the difference. A branch receiving urgent low-fit requests can have a lower overall qualification rate than one receiving routine, well-matched inquiries, even if staff handle each category equally well. The response is to compare like categories first. This is a narrower operational question than a general local audit: it asks whether the apparent performance gap survives a fair comparison.
Use a second, separate hypothetical dataset to illustrate service-mix normalization. In this example the denominator is deduplicated telephone inquiries within one operational system, with a common qualification rule. Location A receives 80 urgent inquiries, of which 16 qualify, and 20 routine inquiries, of which 12 qualify. Location B receives 20 urgent inquiries, of which 4 qualify, and 80 routine inquiries, of which 48 qualify. These records are invented and are not linked to the earlier profile example.
Both branches qualify 20% of urgent inquiries and 60% of routine inquiries. Yet A's overall result is 28 qualified inquiries out of 100, while B's is 52 out of 100. The difference comes entirely from the category mix in this constructed example. Applying an equal 50/50 mix to both produces the same standardized rate: 50% × 20% + 50% × 60% = 40%. That removes the apparent handling difference under the chosen common mix.
Standardization is a comparison tool, not a new observed result. The 40% rate is not what either branch actually achieved. It describes how the rates compare under a selected mix. Choose the reference mix before examining which branch benefits, publish the weights and keep the observed totals beside it. If important categories are missing or definitions differ, the standardized figure can mislead as readily as the raw total.
After accounting for mix, investigate differences that remain. They could involve call handling, service eligibility, capacity, inaccurate information or measurement. Do not automatically attribute them to staff skill or SEO execution. A location with no available appointments can truthfully reject suitable demand that another can accept. The fair next action is a specific test of the remaining mechanism, with the people who know the operating conditions involved in interpreting the records.
Investigate local page and profile differences
Use the cohort result to choose a focused page or profile investigation. If unsuitable calls concentrate around one advertised service, compare the public description with what that branch actually offers. If callers repeatedly reach the wrong branch, inspect the profile destination and telephone route. If questions concern opening hours, verify the hours customers can see and the hours the line is staffed. These are concrete checks prompted by observed classifications rather than a broad checklist performed for its own sake.
A location comparison worksheet should retain the distinction between discovery and operations. The exposure row names the profile views and reporting dates. The action row names call-button clicks. The operations row names connected and qualified inquiries with the system that counted them. The context row records service mix, open days, paid support and capacity. The attribution row states whether matching is established, partial or absent. Keep this as an accessible table that readers can use without interpreting a decorative image.
Inspect the destination as a buyer. Does it identify the actual location or service area, explain what is available and route the intended inquiry correctly? A generic corporate destination may require another location choice; a branch page may omit an important service boundary. Test the actual route before assuming that either design is the cause of a gap. Preserve what works for customers instead of forcing every location into the most successful branch's wording.
Keep factual differences intact. Locations may have different staff, facilities, availability or services. Shared templates should support those differences accurately. Do not borrow another branch's proof or imply that a service is available locally when it is not. A page can become clearer by explaining a constraint, even if that reduces unsuitable contacts. Judge the change against the defined qualified outcome and the customer experience rather than rewarding every additional call click.
When a potential fix is identified, write the expected mechanism. For instance, the correct branch number should reduce wrong-destination calls, or clearer service eligibility should reduce a specific rejection category. State what observation would weaken that explanation. If wrong-branch inquiries remain unchanged after a verified routing correction, examine other entry points. The comparison should help narrow the investigation, not turn a favored page change into the default answer to every location difference.
| Layer | Record and limitation |
|---|---|
| Exposure | Profile views, date range and relevant deduplication rules. |
| Action | Profile call-button clicks; not connected conversations. |
| Operations | Qualified inquiries, system, definition and pending share. |
| Context | Service mix, opening pattern, capacity and paid support. |
| Attribution | Established matching coverage or explicit aggregate-only comparison. |
Build a fair location review
Build the location review around paired evidence. Show observed profile activity beside operational outcomes, then add the normalized comparison only where definitions and coverage support it. Include the reference weights, cohort exclusions and unresolved records. A manager should be able to identify what actually happened, what was calculated for comparison and what remains unknown. Do not hide those distinctions in a footnote beneath a single overall score.
Separate marketing and operating owners. Marketing may control business details, destination pages and campaign targeting. A branch manager or call-center team may control staffing, routing and follow-up. Analytics may control system reconciliation. Give each action one accountable owner and an acceptance check. Shared responsibility can be necessary, but a generic request to improve local performance leaves nobody responsible for the particular failure the evidence identified.
Use a stable review cadence with a qualification lag. A current period with many pending inquiries will look weaker than a mature earlier period if pending records are treated as rejected. Freeze cohorts by inquiry date and revisit them after classification. Show the pending share explicitly. For low-volume locations, combine a longer suitable period or review records directly rather than creating false confidence through increasingly elaborate percentages.
A fair scorecard can contain two outcomes instead of one verdict. One line asks whether the location is reaching and attracting relevant demand; another asks whether the operation is converting suitable contacts into the intended next step. The two may move in opposite directions. If visibility rises but unanswered calls also rise, both facts matter. More discovery may expose a capacity problem without proving that the marketing itself became worse.
Record the next decision and the evidence needed to close it. A corrected phone route can be tested immediately; whether wrong-branch inquiries decline needs later records. A new service description can be reviewed for accuracy on release; whether qualification changes requires a comparable cohort. Keep implementation completion and business observation separate. This allows the team to acknowledge a verified repair while remaining precise about outcomes it has not yet measured.
For implementation support, review Fuel’s local SEO services. Share the affected scope, actual evidence and the decision you need to make.
What to fix when calls fail after the click
When calls fail after the click, inspect the real operational route. Test the displayed number, transfer destination, open-hours behavior and voicemail or callback process. Confirm that the team receiving the call can handle the advertised service or route it appropriately. A profile action counter cannot reveal those failures on its own, and increasing clicks will not make a broken destination usable.
Use the relevant classification to decide what to fix. Missed calls prompt a staffing or routing investigation; wrong-service calls prompt an offer and targeting review; unresolved records prompt a measurement or follow-up check. Multiple causes can coexist, so retain separate reason codes and avoid collapsing them into poor-quality leads. A suitable prospect who reached an unanswered line is different from an inquiry for a service the business never offered.
The useful conclusion is a fair, reproducible comparison with a bounded action. Keep the raw profile figures, the operational definitions, the common cohort and any standardized result together. Explain whether the gap survives adjustment and what you can actually verify next. That gives locations a basis for improvement without rewarding the largest exposure total, penalizing an unfavorable service mix or inventing a conversion chain that the available systems cannot prove.