

To measure AI search traffic, start with GA4 sessions from identifiable AI sources. Put those sessions beside Semrush’s modeled AI-influenced traffic, branded search clicks from Google Search Console, and qualified leads recorded in your CRM. Keep them in separate columns with definitions. The Semrush estimate can include people who saw a brand in an AI response and later visited through branded search or direct navigation. Some may also be present in your observed analytics. Adding the numbers can count the same behavior twice. Semrush measurement announcement
A chief marketing officer needs to know whether AI discovery helps the business. An analyst needs to know which behavior they can actually see. A useful report answers both by showing where the evidence is strong, where it is directional, and what to test next.
What does Semrush’s AI-influenced traffic measure?
On November 18, 2026, Semrush announced AI-influenced traffic in Organic Rankings 2.0, initially rolling out with U.S. and U.K. data. Semrush describes the metric as an estimate of visits influenced by a brand mention or citation in an AI answer. Its model uses aggregated behavior relating brand exposure in an answer to website visits through any channel within 24 hours. Those paths can include direct navigation, branded organic search, and referral clicks. Treat the result as a modeled market and topic signal. Semrush methodology and rollout
Suppose someone learns about a software vendor in an AI answer, types the company name into a browser the next afternoon, clicks an organic result, and books a demo. GA4 may see an organic search session and the CRM may see an application. The Semrush estimate attempts to capture behavior of this kind at an aggregate level. You cannot tie that estimate to a specific visitor record or use it to prove the initial answer caused the demo.
When you capture a Semrush value, retain the market, time period, property or domain, export date, topic filters, and the definition shown in the product. Keep the vendor’s method and any observed changes to the report in your measurement log. Compare competitors within the same view and report vintage. Differences in measurement across national markets or product changes can outweigh a modest change in the metric.
How to measure AI search traffic from referrals in GA4
Open Traffic acquisition, use a session-scoped source and medium dimension, and export sessions alongside landing pages and your chosen outcomes. Session source answers where a visit came from. First user source addresses acquisition of the user and can credit a different source. Pick one based on the reporting question. Use sessions consistently when calculating session-level rates. GA4 Traffic acquisition report
Look at actual source values in your property before creating a classification. Hosts you may see include chatgpt.com, perplexity.ai, and copilot.microsoft.com. Maintain a short allowlist of recognized hosts and explicit subdomains you have validated. A broad rule matching every string containing AI will classify unrelated referrers. Standardize case and domain format. Preserve collected source values and version your classification so someone else can reproduce last month’s totals.
For each recognized source, inspect a sample of landing pages and look for impossible patterns. If almost all sessions appear on a page used internally for demos, you may be looking at your own team. If traffic spikes after adding a new host to the classification, measure how much of the rise comes from the definition change. If a browser or application strips the referral, GA4 may have no way to label it as AI traffic. Leave that behavior in the observed channel it actually received.
You can create an exploration, dashboard mapping, or an export pipeline. For a first pass, a saved report with consistent filters is enough. Where reporting thresholds or source suppression affect the data, disclose the limitation rather than treating blanks as zeros. Use campaign tags only on links your team controls legitimately. AI responses can link to an untagged URL and still produce an identifiable referrer, or they can provide no observable source.
How to add branded search and CRM-qualified leads
Use Search Console to create a brand query group using the company name, common spellings, distinctive product names, and legitimate brand variants. Test the matching pattern against a real export. Generic brand names overlap with nonbrand searches, so review common false positives manually. Compare brand search clicks, impressions, and CTR within the same market. Write down whether a paid brand push, press announcement, major link, promotion, or seasonal surge coincided with a change.
Google’s generative AI performance reports provide a way to see covered AI exposures in Search Console. Treat these impressions as visibility within the surfaces and property the report covers. Use them as an optional fifth signal if they answer a useful decision. They do not tell you which CRM lead saw an AI answer or which non-Google tool influenced a search. Google Search Central AI performance reporting
On the CRM side, keep the original landing URL, source fields or campaign parameters your implementation can reliably collect, creation date, and stages such as duplicate, qualified, booked, or won. Where useful, ask a non-required discovery question with an AI answer option and a short write-in. Retain self-reported discovery in a separate field. A user can remember seeing your brand in ChatGPT while their conversion session arrived via an organic search. Both observations can be true.
Define qualification with the sales team. For example, a B2B lead must request an offered service, be from a supported market, and fit an agreed customer profile. Count unique leads by inquiry cohort and give B2B stages time to mature. Keep unmatched records and missing source as explicit values. A high-quality lead with unknown acquisition still matters to the business and should be visible in the denominator for coverage.
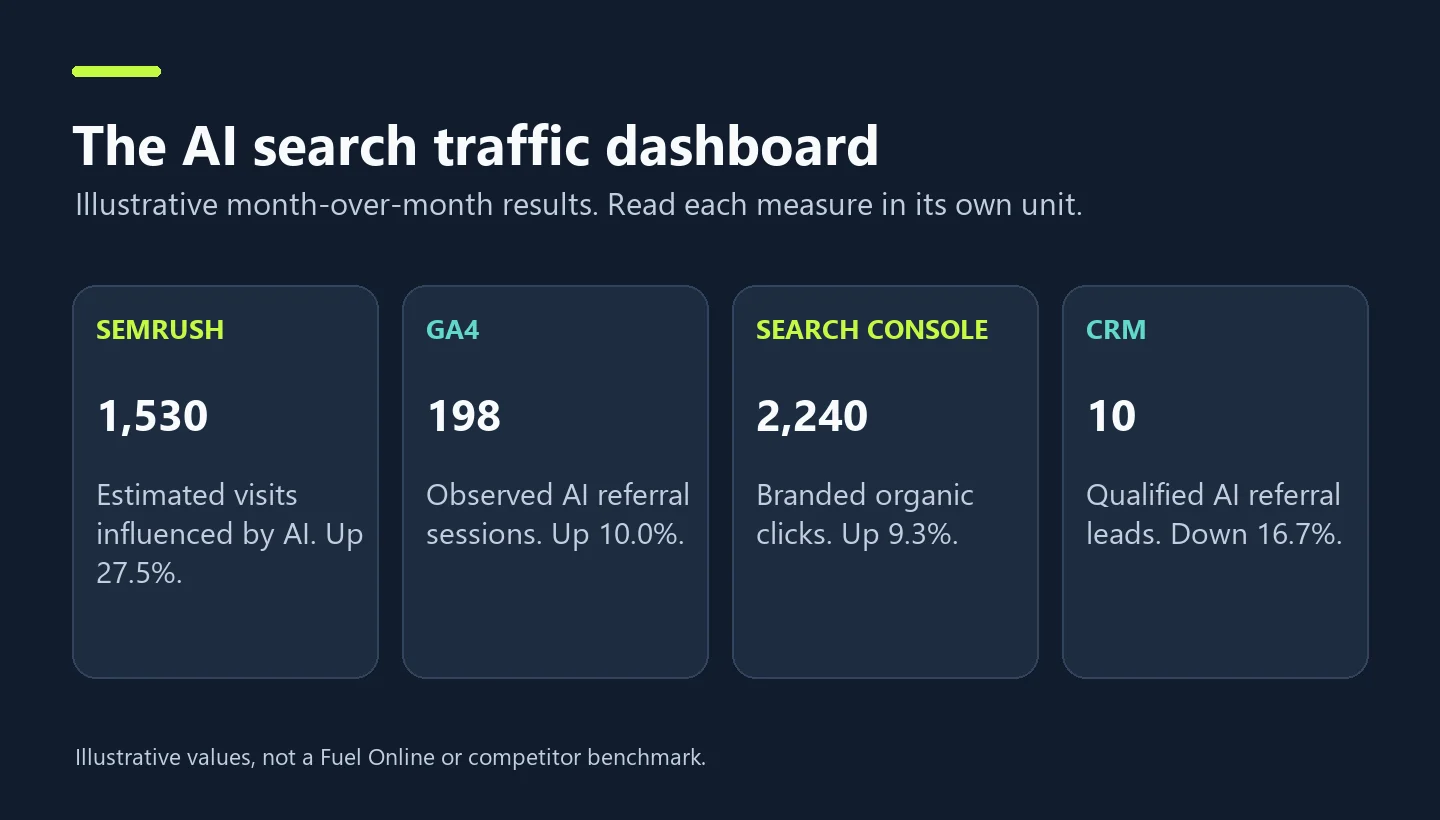
A sample AI search traffic dashboard
| Signal | Example month A | Example month B | Interpretation |
|---|---|---|---|
| Semrush modeled AI-influenced visits | 1,200 | 1,530 | Estimated influence is up 27.5% |
| GA4 observed AI referral sessions | 180 | 198 | Identifiable visits are up 10.0% |
| Search Console branded organic clicks | 2,050 | 2,240 | Branded clicks are up 9.3% |
| CRM-qualified leads from observed AI referrals | 12 | 10 | Qualified lead count is down 16.7% |
| Share of CRM inquiries with usable source | 88% | 86% | Source coverage fell 2 percentage points |
The figures above are illustrative. This is why the dashboard needs a field for interpretation. Estimated influence increased, observed referrals increased more slowly, and qualified leads fell. The analyst should inspect the market and landing page mix before claiming discovery improved. Ten leads across 198 sessions is about 5.1 qualified leads per 100 referral sessions, compared with 6.7 previously. Small counts can move substantially after just a few follow-ups. The decline in matching coverage also matters.
Never report 1,728 visits by adding the Semrush figure of 1,530 and the GA4 count of 198. The first is an estimate of a partly overlapping behavior. The second is a count that the property observed under a specific source rule. For a weekly leadership report, show each trend in its own unit with equal comparison windows and a link to the definitions.
Add a coverage and maturity check
Two of the simplest safeguards are a percentage of CRM leads with usable source and a percentage of recent leads whose sales review is complete. Suppose month A has a mature pipeline and sales has reviewed 96% of inquiries. In month B, only 62% are reviewed. The latest qualified lead count will be less complete even if the actual likelihood of qualification has not changed. Mark the latest cohort provisional and agree on an age when each period is considered mature.
Deduplicate forms, phone calls, and meeting bookings that refer to one opportunity. If a leader wants a business outcome, choose one unit, such as unique qualified inquiries or closed deals, for the headline. Use stage conversion and signed revenue where they are adequately mature. Keep acquisition attribution and pipeline status on the same rules across months so a team can explain an apparent reversal later.
How to benchmark several domains fairly
Choose three domains serving comparable markets and use the same Semrush country, dates, report scope, and version. Compare visibility by topic or normalize each estimated series to 100 in the first period. Indexing makes direction easier to compare across very different business sizes. A baseline close to zero will produce volatile growth rates; show absolute counts alongside percentage changes where appropriate.
For domains you own or have authorization to analyze, line up GA4 and CRM series using equivalent filters, date definitions, and scope. For competitors, limit the comparison to observable public or modeled measurements. Keep private conversion fields blank. Do not make up competitor session counts or infer lead quality from a vendor traffic estimate. Record changes to the websites, pricing, or campaigns you can verify before interpreting divergences.
A workable monthly report uses four decisions. If modeled influence rises and owned referrals and qualified leads rise, go examine which pages and offers are involved. If modeled influence rises and referrals are flat, inspect branded clicks and discovery responses. If referrals rise and qualified leads fall, review landing paths, search intent, and service eligibility. If everything appears flat but source coverage deteriorated, repair instrumentation before drawing a growth conclusion.
Use a hypothesis when the signals disagree
Pick one topic where the site has an answer that could plausibly help a buyer. Improve the destination with evidence, dates, and a clear next step. Track the edited page and a similar page left alone, log the changes, and compare market-level trends after both have had time to gather data. A limited test can guide future content investment even when cross-channel attribution remains incomplete.
Do the same in reverse when a report shows a gain with no useful outcome. Look at noisy acquisition paths, dashboards excluding subdomains, and lead source fields overwritten at form submission. It is possible to make a measurement process more informative without changing a single ranking. That work often changes which content investments make sense.
Make the dashboard reproducible for the next analyst
Each number should have a source, grain, extraction date, and owner. An export from Semrush can be domain by month, a GA4 report can be session source by landing page, and the CRM can be a lead by creation date. Produce aggregate rollups at a shared level such as domain, country, and month. Avoid joining text fields at the visitor level just because a brand name happens to appear in all three systems. Once the report is clear, build a drill-down for the question that gets asked most often.
Save the exact filters used for the dashboard. For example, record which subdomain hosts the public blog, whether the analytics property includes partner sites, and which storefront countries are in scope. Store the Search Console query matching rule and the GA4 referral allowlist in dated copies. When a new referrer is added, calculate last month’s result under both mappings when feasible. This helps readers distinguish an actual change in discovery from a broader definition.
A leadership report can include a confidence field. High confidence might mean the CRM join was validated and the cohort has matured. Directional can cover a third-party estimate or a meaningful pattern with limited coverage. Pending applies when the newest lead cohort is incomplete. Write a short explanation whenever a number changes enough to drive a budget decision. The aim is to show enough evidence for the next action without turning the dashboard into a collection of charts nobody owns.
Bring these four measurements into the same review, even when they live in different systems. If a branded query report lands late, mark that cell pending and keep the reporting cutoff date visible. A withheld value should never silently fall to zero. Include a count of the sessions covered by your referral label as well as the total sessions for context, so growth in referral classification or a change in property coverage does not quietly drive the headline.
AI search traffic FAQs
Can GA4 show every visitor influenced by an AI answer?
GA4 can report sources and activity it receives under your implementation. An unclicked answer, a stripped referrer, a later visit through branded search, or activity in a different browser can escape direct AI referral attribution. Use documented estimates and self-reporting as complementary signals.
Does Semrush report actual GA4 sessions?
The AI-influenced traffic metric is a model. Use it for directional competitive and topic comparison. Use your analytics property for observed sessions and CRM data for commercial outcomes.
What should an executive dashboard put first?
Use qualified leads, pipeline, or revenue from traceable acquisition paths as the outcome. Keep observed referrals and modeled influence visible with definitions and data coverage. A reporting view becomes more actionable when each number has a specific decision attached to it. Fuel Online guide to repeatable AI answer measurement