
Enterprise SEO reporting and accountability framework
Enterprise SEO Reporting That Connects Visibility to Revenue
Enterprise SEO reporting should help leaders decide what to fund, operators decide what to fix, and revenue teams decide whether organic discovery is producing qualified demand. That requires more than a dashboard of rankings and traffic. It requires a controlled pipeline from search visibility and AI exposure through inquiry, qualification, opportunity, and sale.
This guide defines that pipeline, the owners and evidence behind it, and the questions a buyer should ask before accepting an enterprise SEO report. It also separates four signals that are often mixed together: an AI answer mentioning a brand, an AI answer citing a page, a person visiting from an AI surface, and a resulting commercial outcome.
The job of an enterprise SEO report
An executive report is useful when it explains what changed, why it changed, what value moved, and what decision follows. A list of activities does not answer those questions. Neither does a month-over-month percentage without a stable denominator, a comparable period, or an explanation of material business changes.
At enterprise scale, the report must reconcile several systems that describe different parts of the same journey. Search platforms observe impressions, clicks, cited pages, or similar discovery events. Web analytics observes sessions and onsite actions. Marketing automation records known people and nurture stages. A CRM records accounts, opportunities, amounts, and sales stages. Finance determines recognized revenue. Each system has its own identity rules, time windows, and failure modes.
A credible reporting program does not force these sources into false precision. It shows which numbers are directly observed, which are joined, which are modeled, and which are unavailable. It preserves source totals before applying filters. It also makes late CRM updates and attribution changes visible rather than silently rewriting history.
For buyers, the practical test is simple: can the team trace an executive conclusion back to a documented definition, source, query, cohort, and accountable owner? If it cannot, the dashboard may be attractive, but it is not a management system.
1. Establish a reporting contract before building dashboards
A reporting contract is the written agreement that keeps teams from redefining success after the result is known. Approve it with SEO, analytics, demand generation, sales operations, finance, privacy, and the business unit owners whose performance appears in the report.
Minimum reporting contract
| Field | Decision to document | Example evidence |
|---|---|---|
| Business objective | Which outcome is SEO expected to influence? | Qualified pipeline, product adoption, store visits, renewals |
| Population | Which sites, markets, brands, page types, and languages are included? | Approved host and route inventory |
| Metric definition | What exactly counts, and what is excluded? | Data dictionary with formula and filters |
| Time basis | Which date governs the cohort and comparison? | Visit month, inquiry date, or opportunity-created date |
| Attribution | How does a touch receive credit and for how long? | First touch, last touch, assisted, or multi-touch rule |
| Identity join | How are anonymous visits connected to people and accounts? | Consent-aware ID and CRM matching logic |
| Owner | Who investigates a break and who approves a definition change? | Named role and escalation route |
| Freshness | How late can each source arrive? | Daily search data, weekly CRM reconciliation |
| Revision policy | How are backfills and restated periods labeled? | Version log and locked executive snapshot |
Every metric should have a numerator, denominator, source, grain, owner, latency, and known limitation. “Conversion rate” is incomplete. “Qualified inquiries divided by submitted eligible inquiries from organic landing sessions, grouped by inquiry month and matured for 60 days” is reviewable.
Do the same for attribution. Adobe’s documentation describes attribution as a combination of a model, a container, and a lookback window. Its examples show why the model alone is not enough: teams also need to define which interactions share the calculation and how far back it looks. Review the Adobe Analytics attribution components when documenting those choices.
2. Build a measurement pipeline with observable handoffs
Think of reporting as a data product with five stages. Each stage should preserve its input, transformation, output, validation test, and owner.
- Collect: retain raw discovery, web, lead, CRM, and revenue data at the most useful permitted grain. Record ingestion timestamps and source-specific IDs.
- Normalize: standardize URLs, hosts, markets, channels, campaign values, product names, currencies, and time zones. Keep the original value beside the normalized value.
- Classify: assign brand or nonbrand query class, page family, intent, business unit, AI surface, lead eligibility, and account segment using versioned rules.
- Join: connect events only when a defensible key exists. Report unmatched records and join coverage rather than dropping them invisibly.
- Publish: produce role-specific views from one certified semantic layer, then retain the dated output used for the decision.
The pipeline needs automated controls. Useful controls include source row counts, missing-date checks, duplicate-ID rates, unknown-channel rates, consent-state coverage, CRM stage reversals, currency conversion dates, and variance against the prior extract. Set thresholds by source and route the exception to a named owner. “Dashboard looks odd” is not a control.
Use a metric lineage record for every executive KPI. It should name the source tables, transformations, classification version, exclusions, and destination tiles. When a definition changes, preserve the previous version and show whether historical periods were restated. This protects the team from a common failure: a cleaner pipeline appears to reduce performance because duplicates or ineligible records were removed.
Report at three operating speeds
- Operational view, daily or weekly: tracking health, crawl or indexing exceptions, landing-page changes, broken forms, missing CRM IDs, and work in progress.
- Performance view, monthly: qualified demand, nonbrand acquisition, content and template cohorts, AI visibility, pipeline contribution, and completed tests.
- Investment view, quarterly: durable trends, market and product coverage, forecast assumptions, realized pipeline, resource constraints, and the next portfolio decision.
These views share definitions but answer different questions. A weekly view helps an operator catch a broken form. A quarterly view helps an executive decide whether to add engineering capacity. Combining both into one crowded dashboard usually weakens each.
3. Separate brand and nonbrand demand without hiding ambiguity
Brand demand often reflects awareness created by many channels, existing customers, navigational behavior, and prior reputation. Nonbrand demand more often represents category, problem, comparison, or use-case discovery. Reporting the two together can make SEO look healthier while obscuring whether the program is expanding reach beyond people who already know the company.
Create a versioned classification dictionary. Include the corporate name, product names, common misspellings, acquired brands, discontinued names, domains, executive names only when clearly navigational, and combinations such as “brand pricing” or “brand login.” Give ambiguous terms a separate class instead of forcing them into a convenient category. A product name that is also a generic noun may require market, query, and landing-page context.
Always display the denominator. For query impressions, nonbrand share equals nonbrand impressions divided by all classified impressions, excluding unknowns from neither the table nor the review. For visits, nonbrand organic share equals nonbrand organic visits divided by organic visits with a usable query or landing-page classification. These denominators are different, so their percentages should not be compared as if they describe the same population.
| Class | Observed visits | Share of all 1,000 visits | Reporting note |
|---|---|---|---|
| Nonbrand | 620 | 62% | Problem, category, comparison, and use-case discovery |
| Brand | 300 | 30% | Corporate, product, domain, and approved variants |
| Unknown | 80 | 8% | Retained as an explicit data-quality class |
| Total | 1,000 | 100% | Fixed cohort denominator |
Avoid inferring a query for every visit when the source does not provide one. A landing page can support a probability or a content-intent class, but that is modeled information and should be labeled accordingly. Keep directly observed query classifications separate from inferred landing-page classifications.
4. Measure AI visibility as four distinct layers
AI reporting is immature and coverage varies by platform, geography, account, query, and time. A disciplined report starts with what was actually observed and does not turn a sampled prompt panel into a claim about the entire market.
- Observed mention
- The brand, product, person, or defined entity appeared in a captured answer. Record the exact query, answer, surface, date, locale, account state where permitted, and capture method. A mention can be positive, neutral, negative, or factually wrong.
- Observed citation
- A captured answer displayed a source reference or link to an owned URL. Record the cited URL and visible context. A citation is not a ranking position, endorsement, or proof that the cited text drove the answer.
- Observed referral
- An analytics record shows a visit attributed to an AI surface under the approved channel rule. Preserve referrer and campaign evidence when available. Some journeys will not pass a detectable referrer.
- Observed commercial outcome
- An inquiry, qualified lead, opportunity, or sale is joined to the referral or credited under the approved attribution rule. State the rule and lookback window. Do not label influenced pipeline as sourced revenue.
These layers form a sequence of evidence, but they do not form a guaranteed funnel. Many observed mentions have no owned citation. Many citations produce no click. A visit can occur after an uncaptured answer. A sale can have several touches. Report each layer on its own denominator and show joins only where the data supports them.
OpenAI explains that allowing OAI-SearchBot helps make public pages eligible for inclusion in ChatGPT search, while placement is not guaranteed. It also tells publishers that referral traffic can be tracked and identifies utm_source=chatgpt.com for referral URLs. Those statements support discovery and measurement setup, not a promise of citation. See OpenAI’s ChatGPT search documentation and publisher FAQ.
Microsoft’s Bing Webmaster Tools AI Performance documentation describes total citations, average cited pages, sampled grounding queries, page-level citation activity, and trends across supported AI experiences. It explicitly says these measures do not establish placement, page importance, ranking, or the role of a page in an individual answer. That makes it useful evidence for citation activity, with clear limits. Read the Bing AI Performance announcement.
Design an AI observation panel
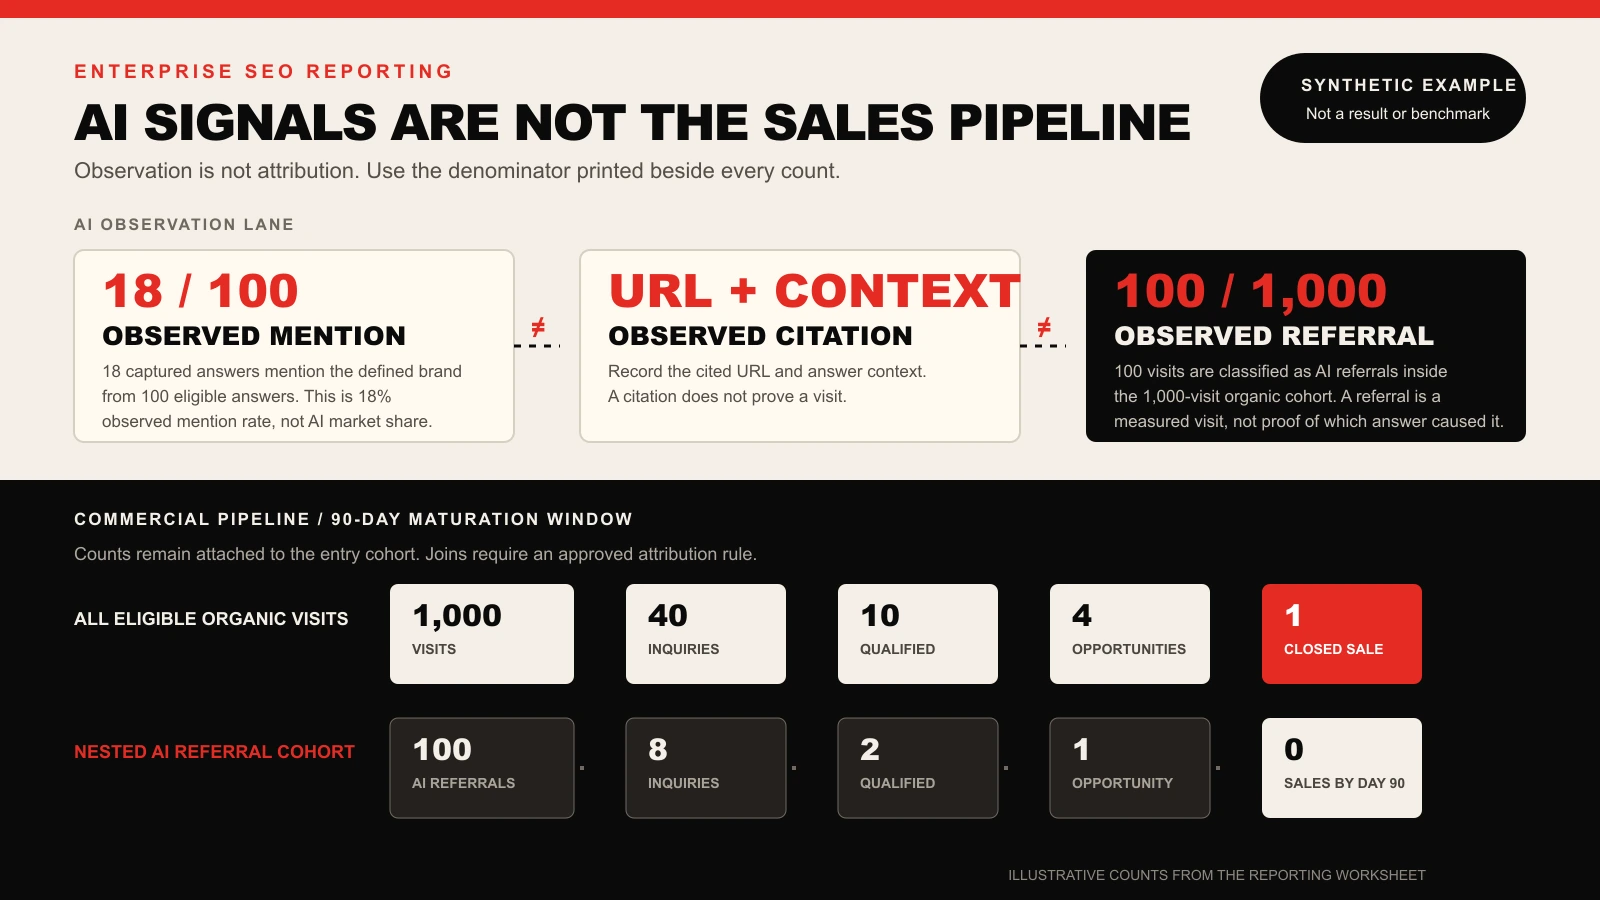
Define a stable set of prompts by audience, buying stage, market, and topic. Keep a holdout set for periodic discovery so the fixed panel does not become the whole strategy. Record the panel size, execution cadence, eligible responses, failures, and exact observation denominator. If 18 of 100 eligible captured answers mention the brand, the observed mention rate is 18%. It is not “18% AI market share.”
Track citation coverage as cited owned URLs divided by the owned URLs you intentionally monitor, or answers with an owned citation divided by eligible captured answers. Name the denominator in the metric label. Preserve screenshots or machine-readable captures according to legal and platform rules, and recheck factual claims that could affect customers.
5. Assign accountability to decisions, not dashboard tiles
Every recurring report should end with a decision log. For each material change, record the interpretation, action, owner, due date, expected leading indicator, expected business outcome, and next review date. This turns reporting into an operating cadence rather than a presentation ritual.
| Artifact | Accountable role | Required review |
|---|---|---|
| Metric dictionary | Analytics lead | SEO, revenue operations, finance, privacy |
| Brand dictionary | SEO strategy lead | Brand, product marketing, regional teams |
| AI prompt panel | SEO or AI visibility lead | Brand, product, legal where required |
| Lead qualification rule | Revenue operations | Sales, demand generation, finance |
| Pipeline release | Data product owner | Source owners and business owners |
| Executive interpretation | Enterprise SEO program owner | Marketing and business leadership |
| Revenue recognition | Finance | Sales operations and business leadership |
Use service-level expectations for data failures. A broken form or missing CRM join deserves a faster response than a delayed informational dashboard. Define severity from business impact, affected markets, duration, and recoverability. The response owner should be the team that controls the failing system, while the SEO program owner tracks impact and communicates the reporting limitation.
Require narrative discipline. Each conclusion should distinguish observation, interpretation, and proposed action. “Nonbrand qualified inquiries fell 20%” is an observation only after the denominator and cohort are validated. “Loss of comparison-page visibility caused the decline” is an interpretation that needs supporting page and query evidence. “Repair the comparison template” is an action with an owner and acceptance test.
6. Worked example: one cohort from visits to sales
Illustrative disclosure: every value in this example is synthetic. It demonstrates the calculations and reporting structure. It is not a Fuel Online result, a client result, a benchmark, a forecast, or a guarantee.
Assume a January cohort contains 1,000 eligible organic visits. Those visits produce 40 eligible inquiries, 10 qualified inquiries, four sales opportunities, and one closed sale. The cohort uses the visit month as its entry date and is allowed to mature for 90 days. Late stage changes remain attached to the January cohort.
| Stage | Count | Stage conversion | Conversion from 1,000 visits |
|---|---|---|---|
| Eligible organic visits | 1,000 | Entry cohort | 100% |
| Eligible inquiries | 40 | 40 ÷ 1,000 = 4% | 4% |
| Qualified inquiries | 10 | 10 ÷ 40 = 25% | 10 ÷ 1,000 = 1% |
| Opportunities | 4 | 4 ÷ 10 = 40% | 4 ÷ 1,000 = 0.4% |
| Closed sales | 1 | 1 ÷ 4 = 25% | 1 ÷ 1,000 = 0.1% |
The arithmetic is simple. The definitions are the hard part. The report must state what makes a visit eligible, how repeat inquiries are deduplicated, who qualifies an inquiry, which CRM stage counts as an opportunity, what makes a sale closed, and whether cancellations or reversals restate the cohort.
Add uncertainty where counts are small. One sale from this cohort is observed, but it is not enough to claim a stable 0.1% sales rate for future traffic. Show multiple matured cohorts, the raw counts, and the effect of high-value outliers. A percentage without its count can make a small change look dependable when it is not.
If 100 of the 1,000 visits were classified as AI referrals and those visits produced eight inquiries, two qualified inquiries, one opportunity, and no closed sale by day 90, report those counts as a nested observed cohort. Do not conclude that AI visibility produced no revenue across all journeys. The report has measured one defined referral cohort, under one attribution rule, for one maturation window.
What to require from an enterprise SEO reporting partner
A reporting partner should be able to show the operating artifacts before promising a dashboard. Ask to see a sample metric dictionary, lineage record, exception log, brand classification policy, AI observation protocol, cohort report, decision log, and change-control process. Remove confidential examples if needed, but do not accept a methodology that exists only in a sales presentation.
- Ask which metrics are directly observed, inferred, modeled, or imported from another team.
- Ask how unknown values, missing referrers, blocked consent states, and unmatched CRM records appear.
- Ask whether brand and nonbrand classifications are versioned and reviewable by region.
- Ask how prompt samples are selected and how failed or ineligible AI observations affect the denominator.
- Ask whether sourced, influenced, and recognized revenue are separate fields.
- Ask who can reproduce an executive number and how long that reproduction takes.
- Ask what action each recurring report is designed to trigger.
The related enterprise SEO audit framework shows how to move from evidence to implementation tickets. The planned enterprise SEO tools guide covers the systems that support collection, QA, and workflow. For portfolio planning, use the enterprise SEO strategy guide. Buyers comparing operating models can also review the enterprise SEO agency guide.
Build the reporting system around your decisions
Fuel Online’s enterprise SEO services can connect technical, content, analytics, and revenue stakeholders around one reporting contract and accountable workstream. For programs that need dedicated monitoring across answer engines and AI-driven discovery, review our AI SEO packages.
A useful first working session should identify the executive decisions the report must support, inventory the available source systems, expose definition conflicts, and select one cohort that can be reconciled end to end. That produces a concrete reporting backlog before anyone spends months rebuilding dashboards.
Enterprise SEO reporting FAQs
What should an enterprise SEO report include?
It should include discovery visibility, qualified onsite demand, pipeline and revenue outcomes where joinable, technical and content delivery status, agreed comparisons, data limitations, and a decision log with owners and dates. Every KPI should link to a stable definition and denominator.
How should brand and nonbrand SEO traffic be reported?
Use a versioned classification dictionary, retain an unknown class, and show observed and inferred classifications separately. Report the count and denominator beside every share or conversion rate so leaders can see what population the percentage represents.
What is the difference between an AI mention and an AI citation?
A mention is an observed appearance of a defined brand or entity in a captured answer. A citation is an observed source reference or link to a specific owned page. Neither proves a visit, ranking position, endorsement, or sale.
Can enterprise SEO reporting prove revenue attribution?
It can document observed and attributed relationships under a defined model, identity join, and lookback window. It should separate sourced, influenced, and recognized revenue and disclose unmatched journeys. Complex buying paths rarely support absolute causal proof from reporting alone.
How often should enterprise SEO reporting be reviewed?
Use daily or weekly monitoring for tracking and operational failures, monthly reviews for performance and workstream decisions, and quarterly reviews for investment and portfolio choices. The source freshness and sales-cycle length should determine when each cohort is mature enough to interpret.